Power grids
Transmission and distribution grids
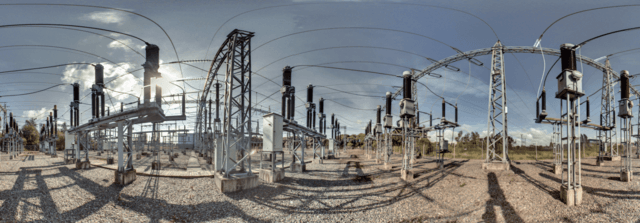
Visimind has extensive experience and a deep understanding of the transmission and distribution of energy, particularly when it comes to data management and planning. We have developed unique data management system tools and technologies to document, monitor and analyse information related to substations, overhead lines, pylons and towers and their surroundings.


What do we offer?
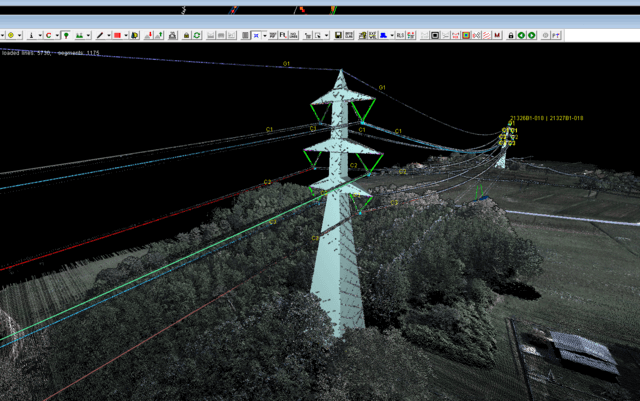
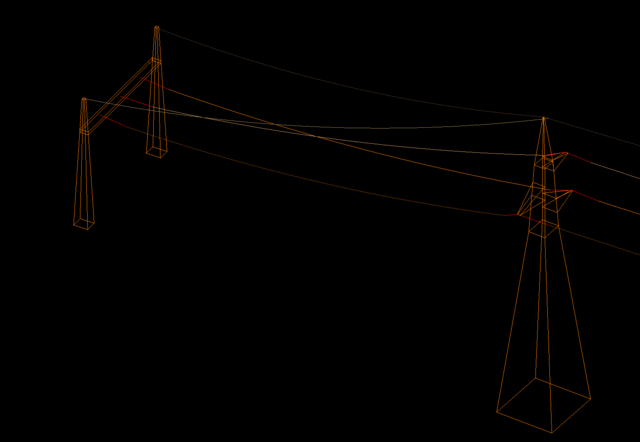
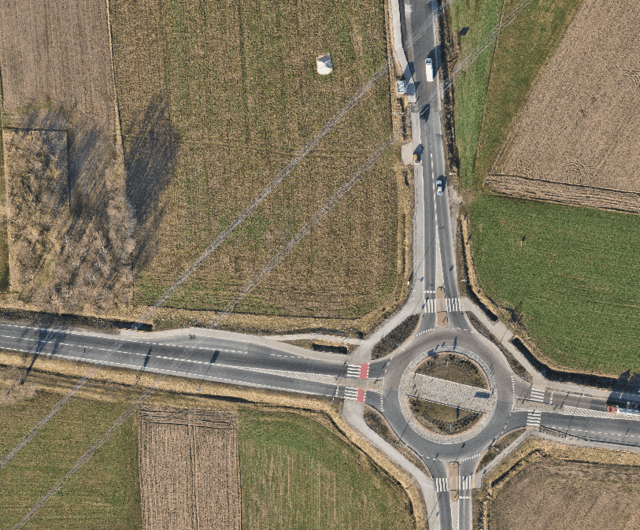
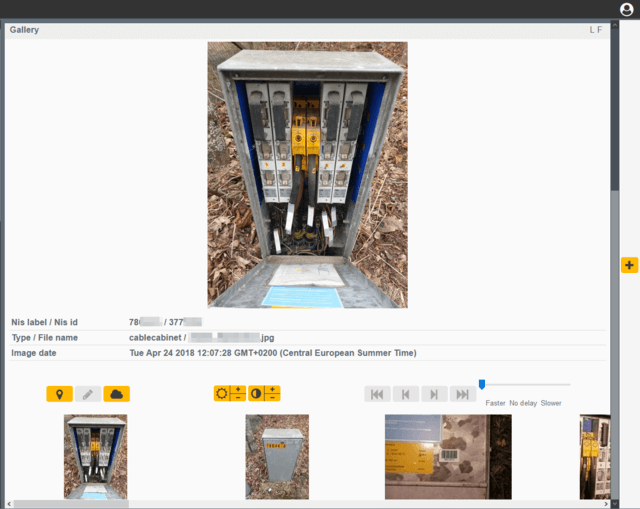
We can document your grid and its surroundings from the air and from the ground. The collected data is processed and we deliver information about technical status, geographical position and environment. According to this information we supply your organisation with 2D and 3D high resolution images and 3D models of your data. We also deliver GIS tools for the effective viewing of our data in combination with your maintenance systems and GIS.
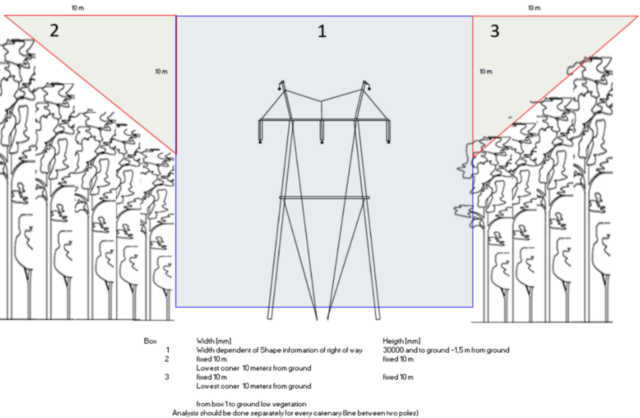
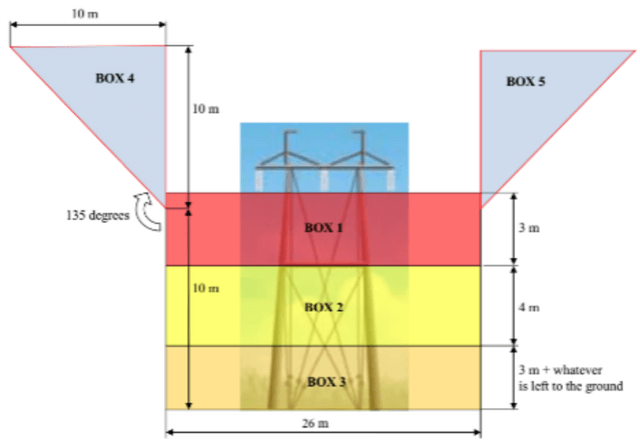
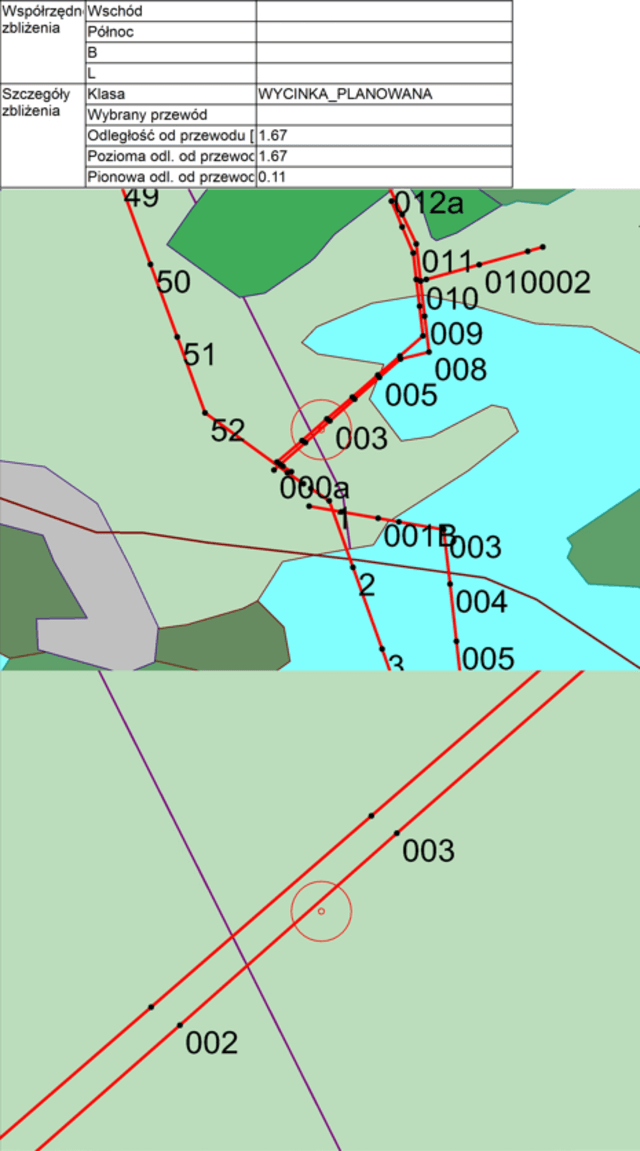
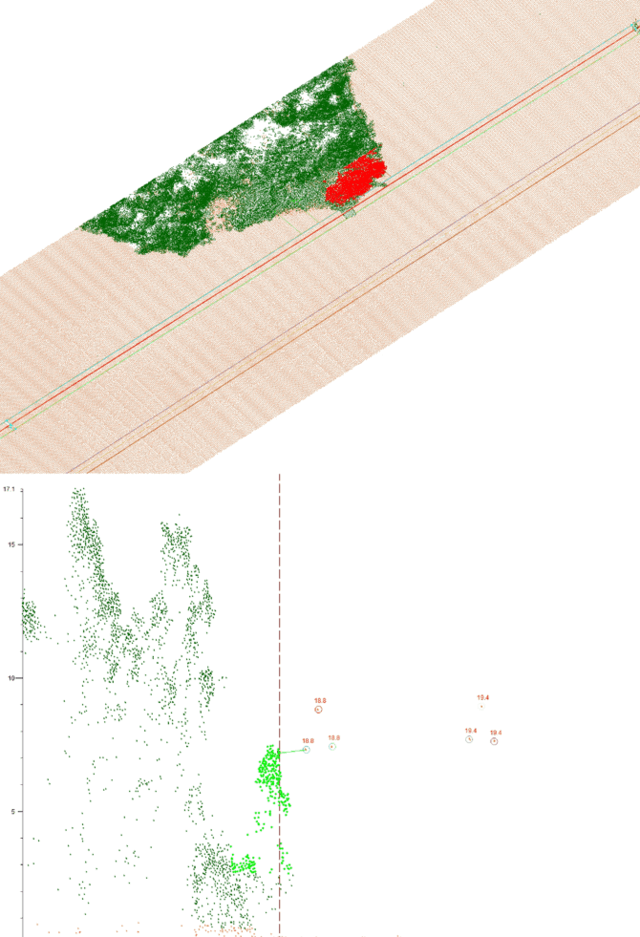
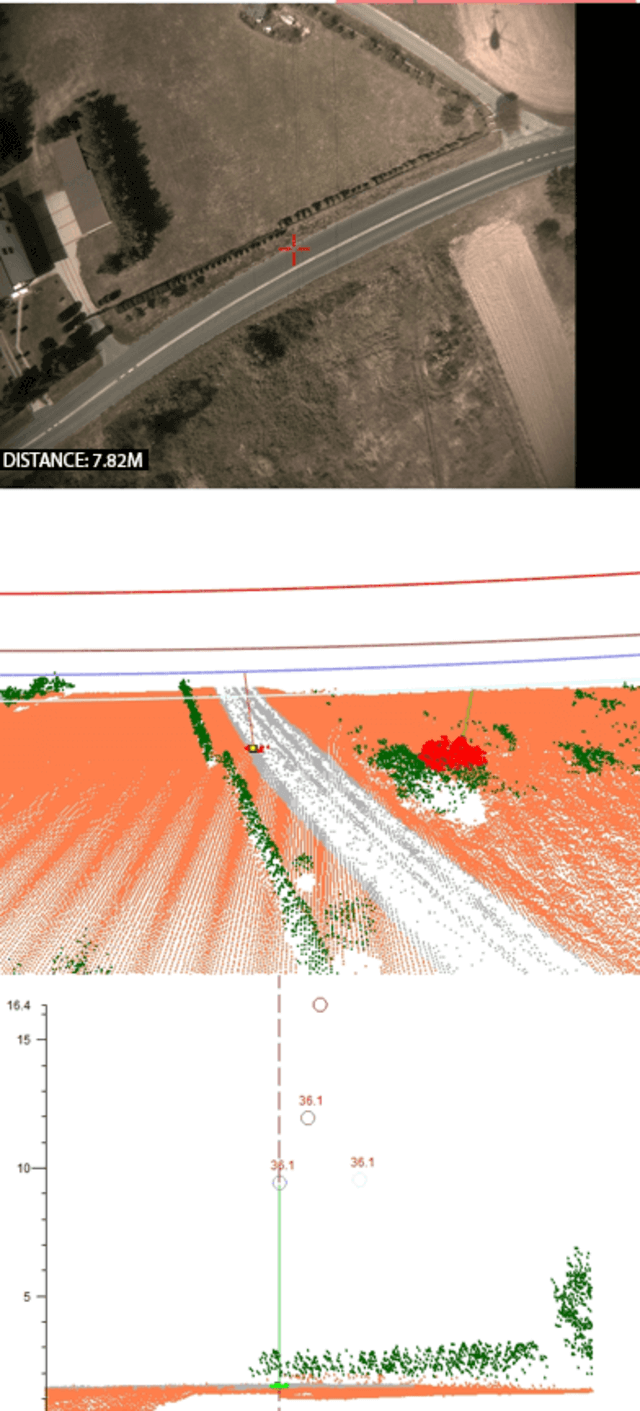
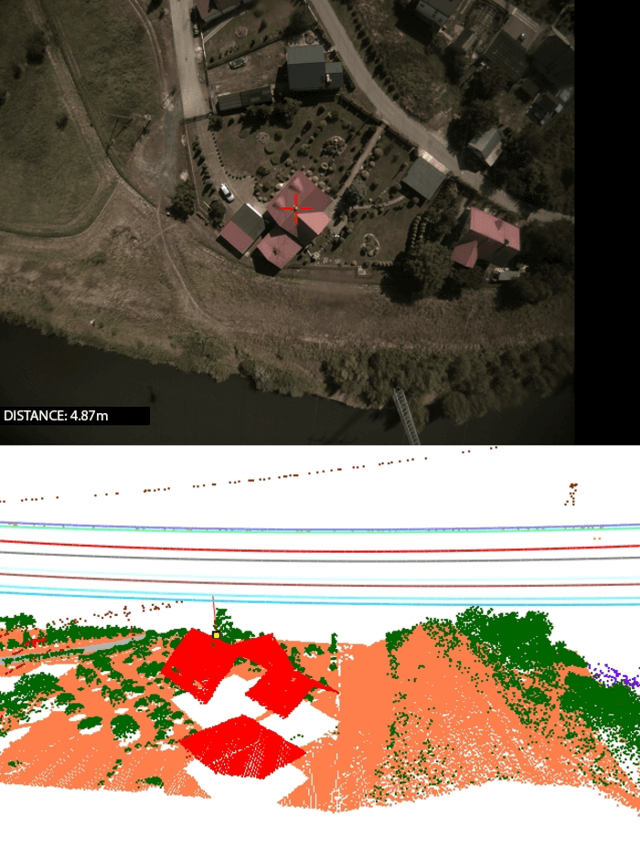
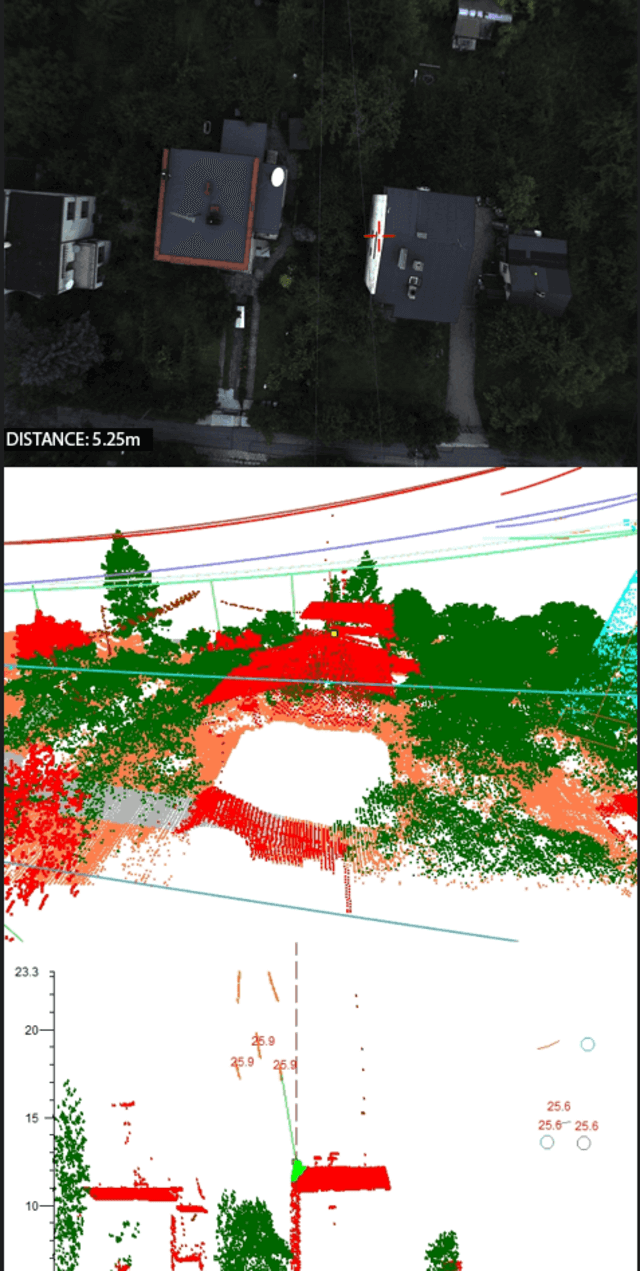
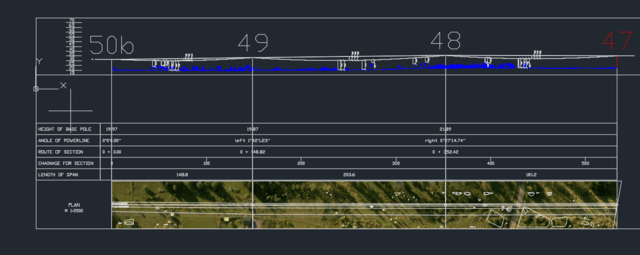
 Automatic analysis of the distance of powerline conductors from the ground, roads, etc...
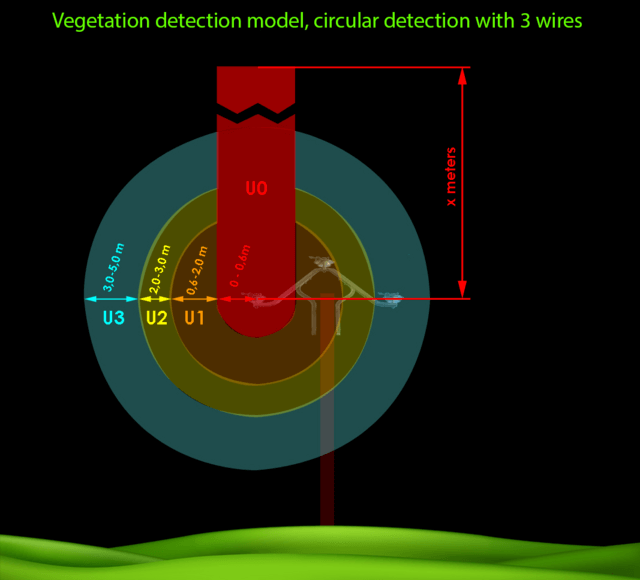
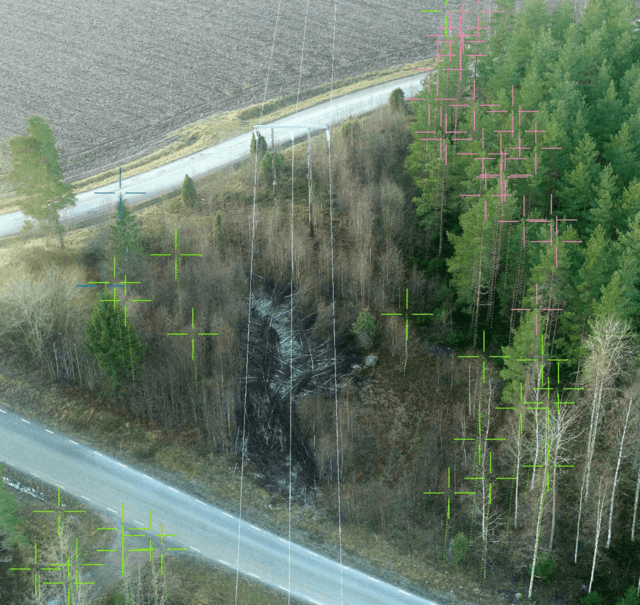
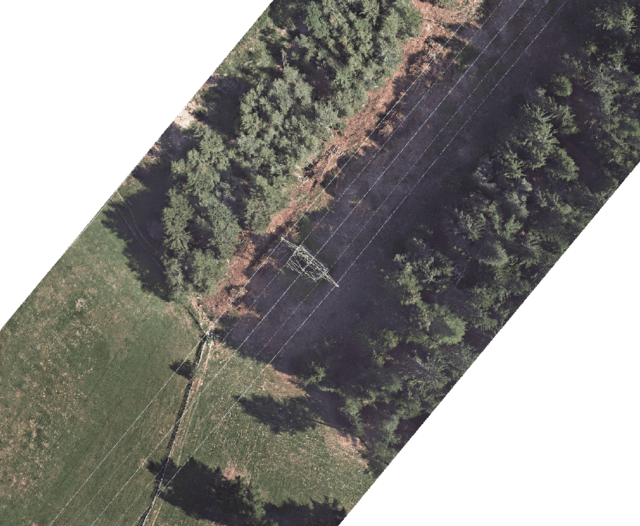
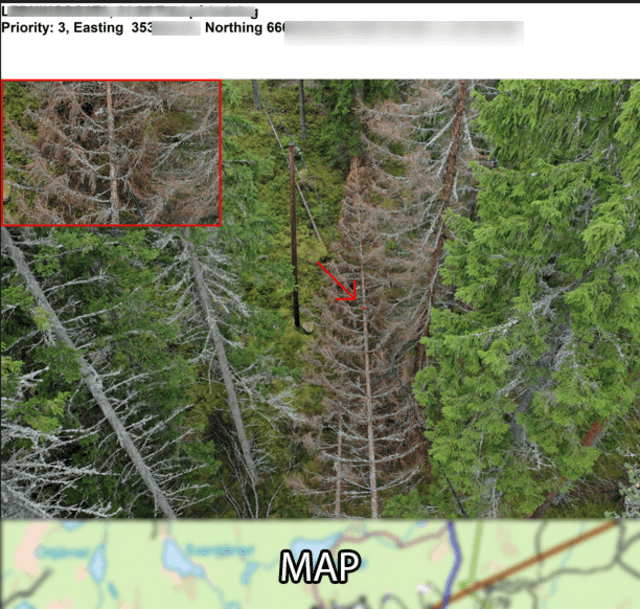
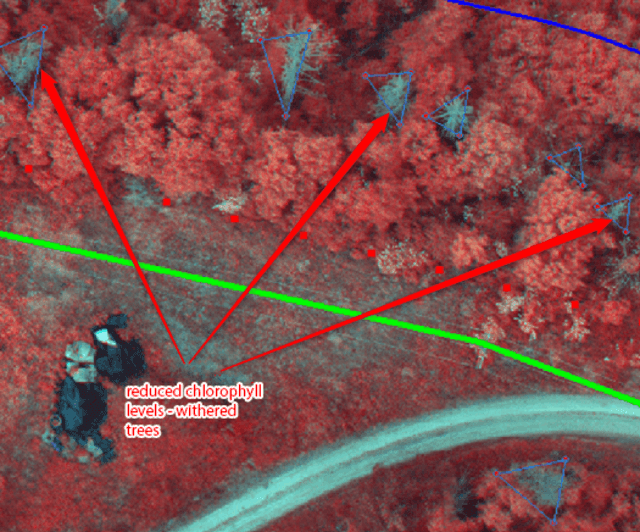
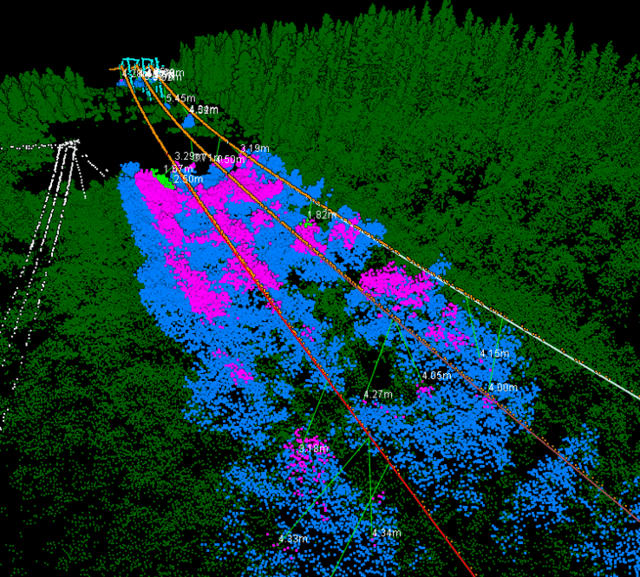 Detection of collisions to vegetation/trees
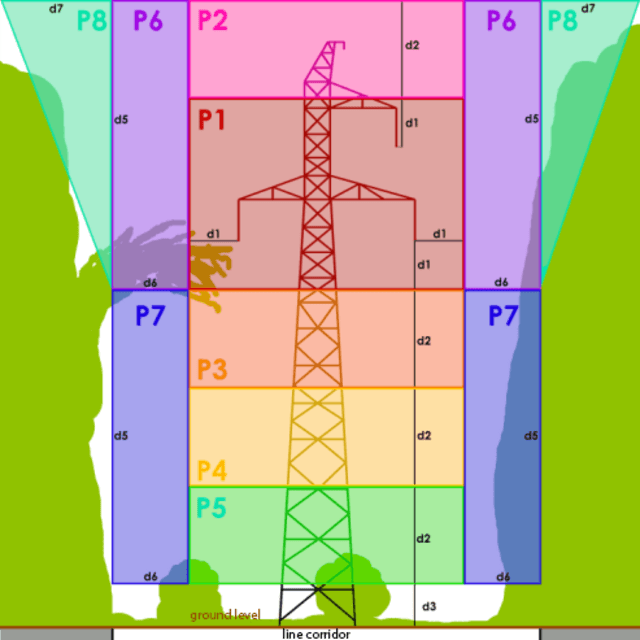
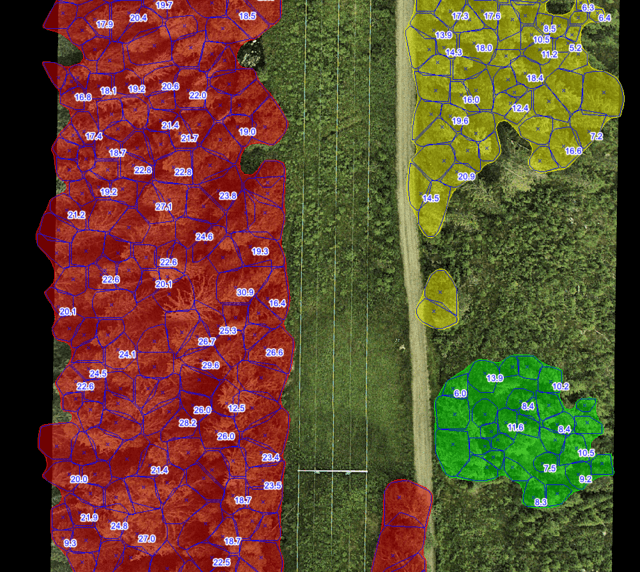 Map of trees in the protective band of the line with height class
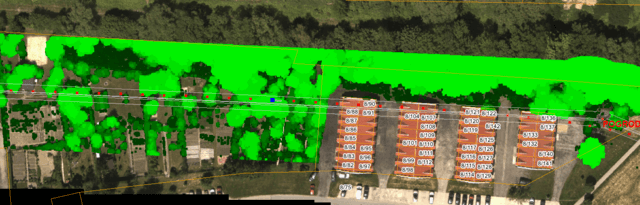 Vegetation maps in the protection band of the line
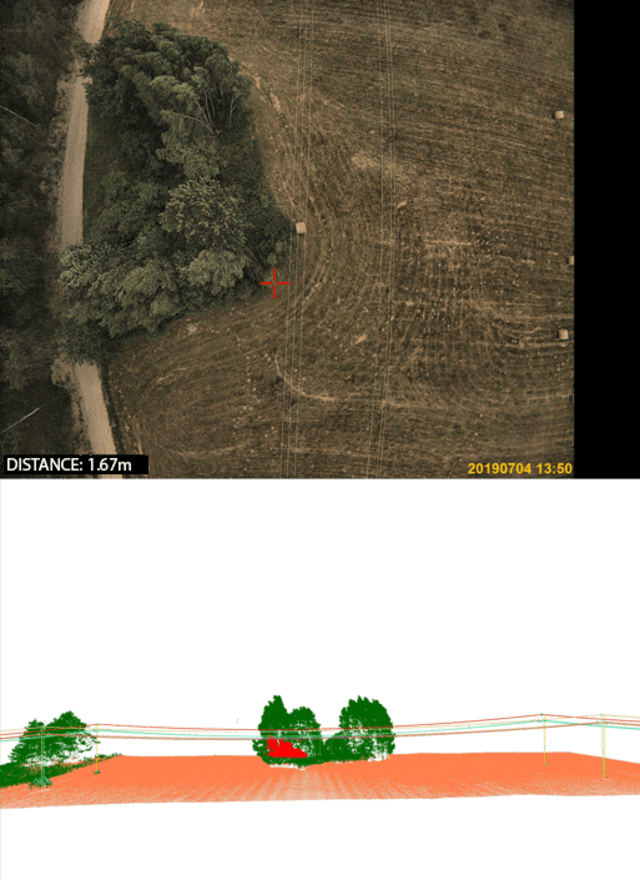
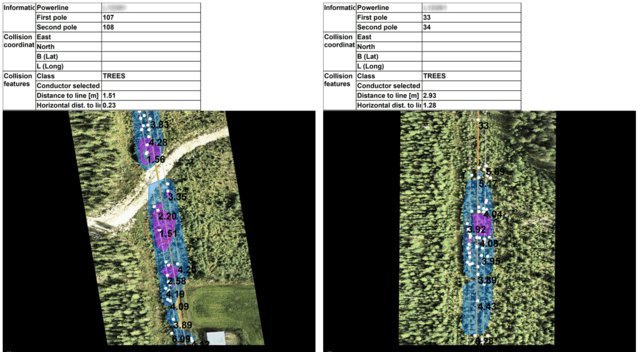 Presentation of results - tree felling reports
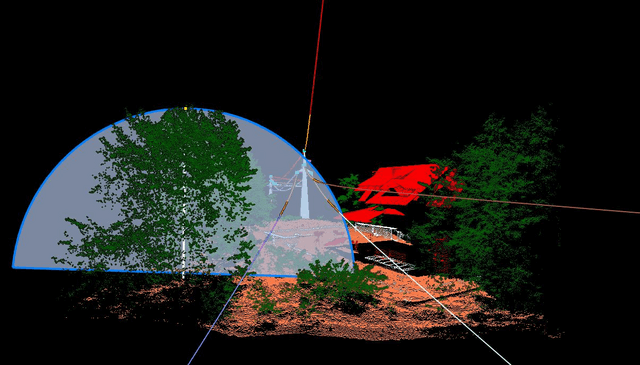
 Object analysis of vegetation in the vicinity of the line - predicted vegetation growth
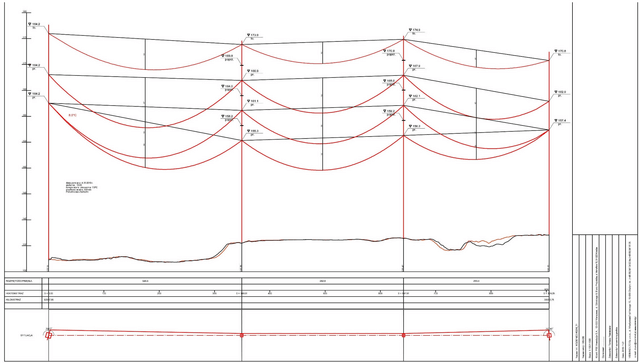
 Vegetation analysis for different line states. The effect of wind on the position of the wires
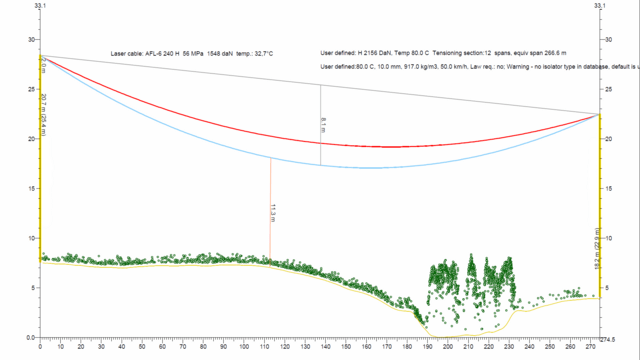
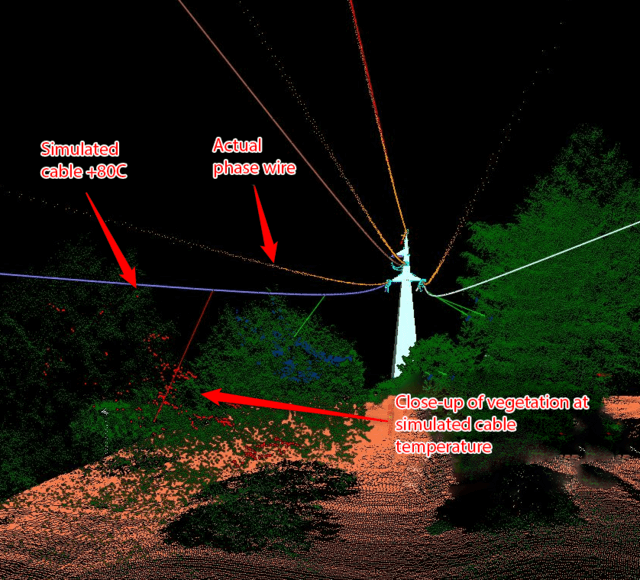 Analysis of the distance of wires to trees and other objects for different line states. Effect of temperature on the position of wires
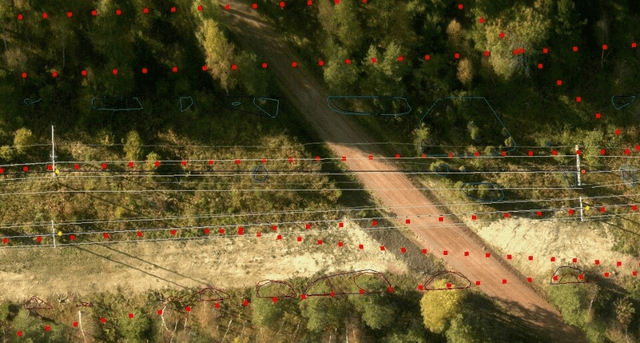
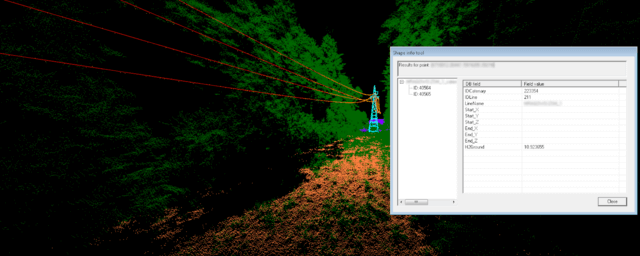
 Geodatabase - contouring/inventory of objects in the protective band of the line
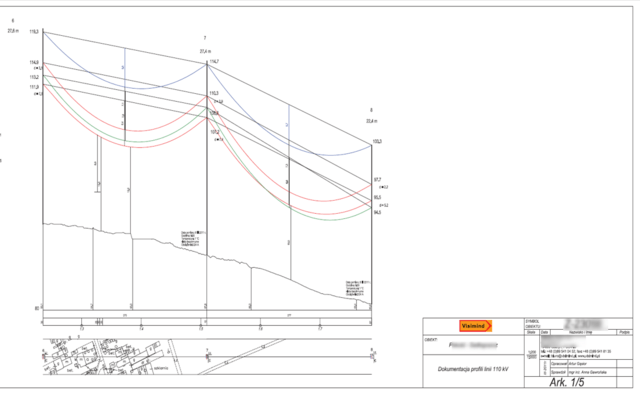
 Integrations - PLS CAD, Google Earth, Arc GIS
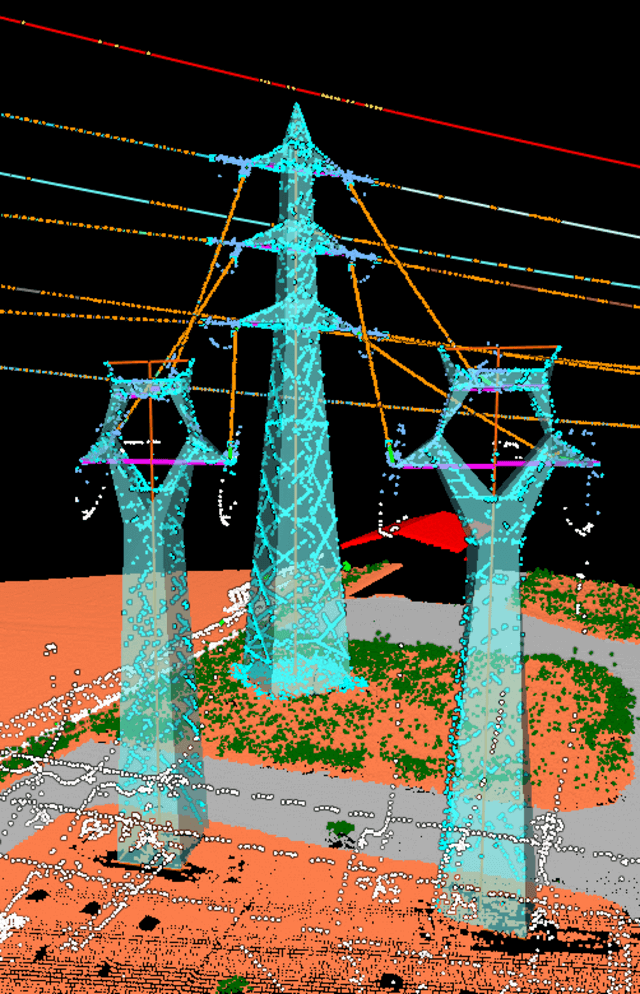
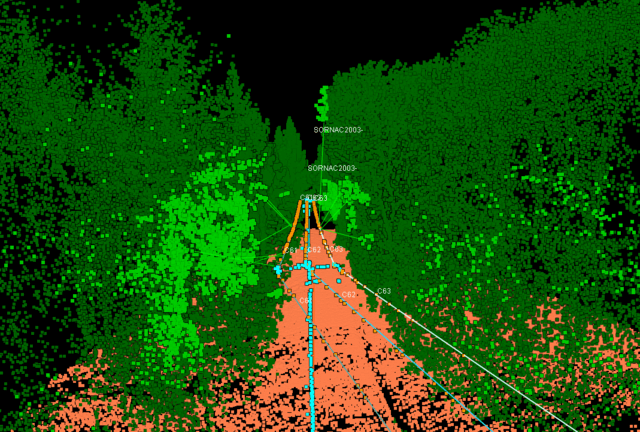
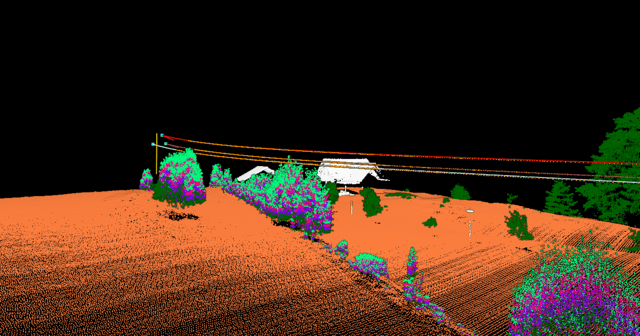
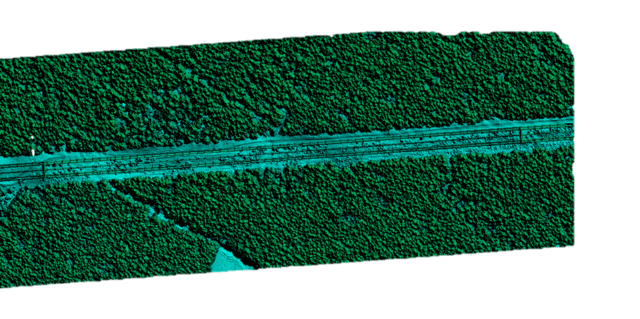 Generation of terrain and land cover models based on point cloud from airborne laser scanning
 Asset data acquisition
What do we actually collect during our flights?
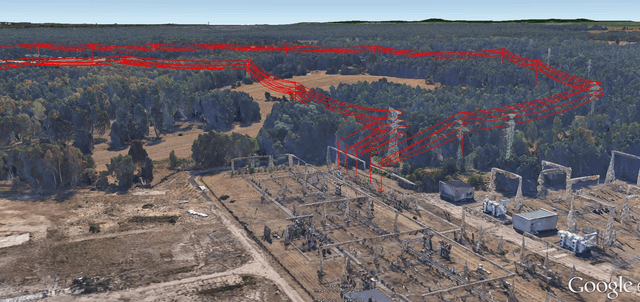
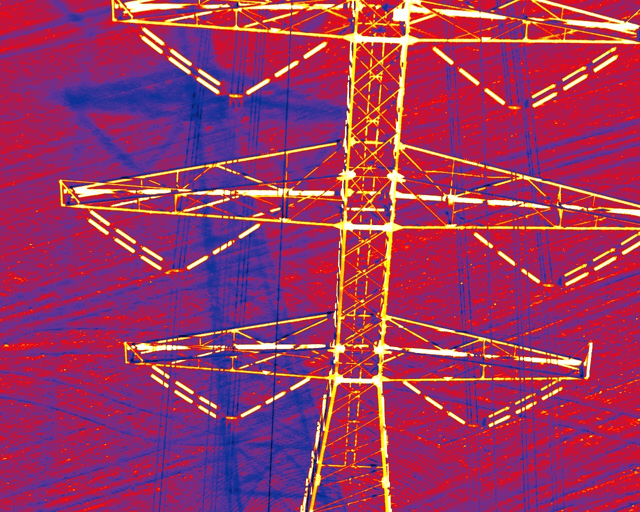
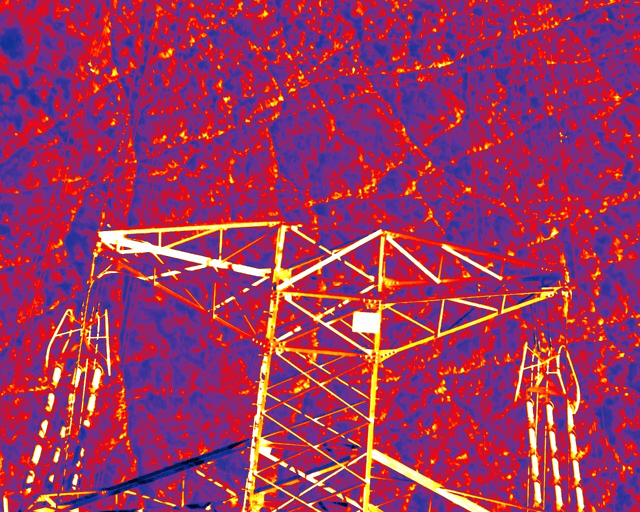
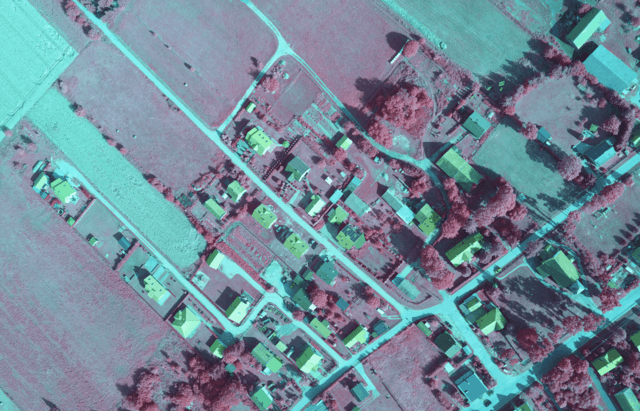
Visimind’s own developed technology allows us to acquire images, 3D range information (LiDAR) as well as temperature and UV radiation data, all in one flight. All of this information is linked to 3D coordinates that give you precise map locations.
Why do I need all this information?
Our goal is to increase your efficiency and lessen the impact of technology on the environment. Our images allow you to view your data from your office at any time, and return to it without actually travelling to the location, thereby avoiding time-consuming and costly controls and field trips.
With the 20 years of research carried out in cooperation with some of Europe’s biggest distribution companies such as Vattenfall, you can rest assured that our methods are thoroughly developed and proven.
We also can reduce environmental impact when compared to existing methods. Our flights are performed at an altitude of 20-100m above the overhead lines at cruising speed, thereby reducing fuel consumption by up to 50%, and significantly lowering CO2 emissions.
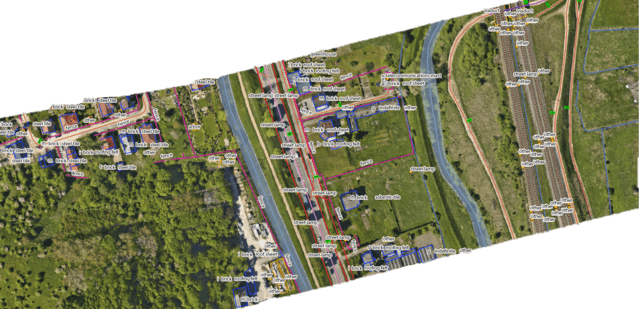
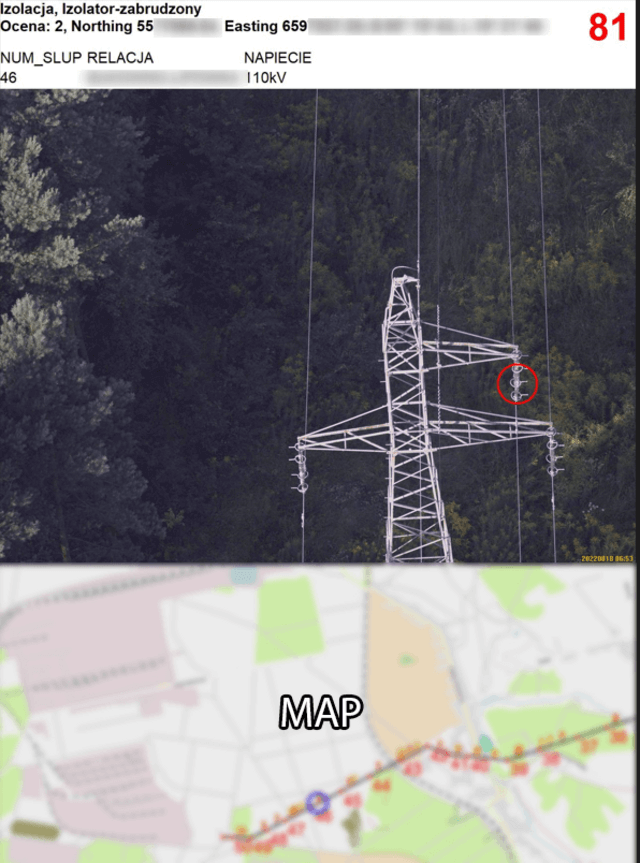
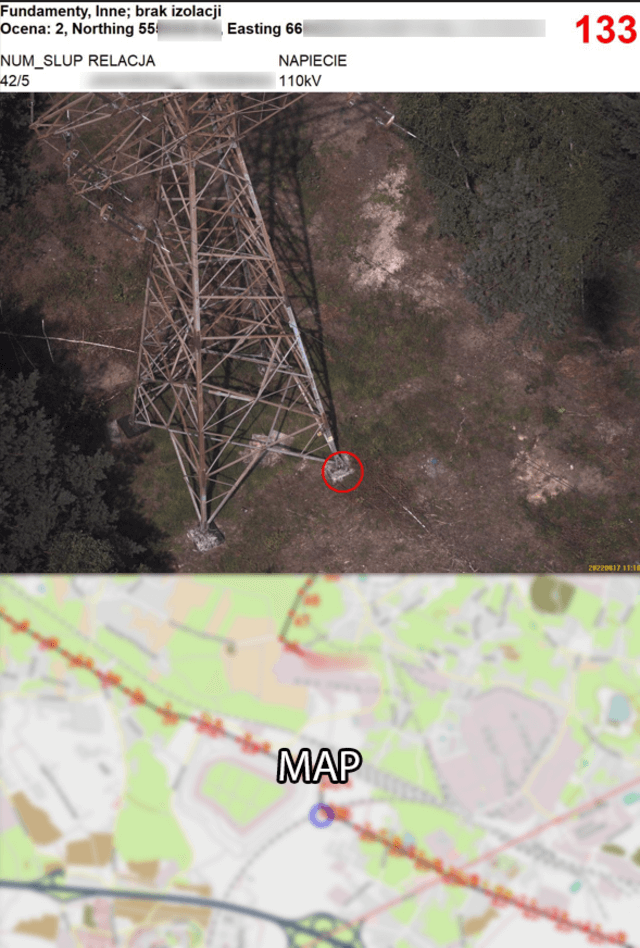
Our images has many details which in turn means that you can extract all the important information you need by cursoring and zooming into the image. Our software enables you to link your notes and remarks to any object within the image, and its position and location will be automatically added and marked the map.
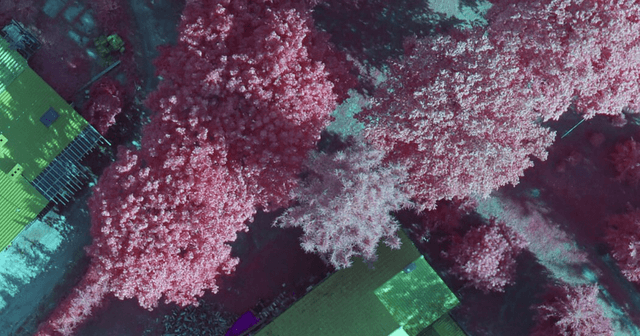
Visimind systems provide all the information you need so you can effectively manage vegetation along the powerline structure. You will be able to effectively analyse and minimise the risk of accidents, damage and technical problems caused by improper maintenance and afforestation.
In a single project, data from hundreds of kilometres of power lines can be collected using photogrammetry and airborne laser scanning.
Our solutions can support companies by:
- Minimizing the likelihood of power supply interruptions caused by the poor technical condition of lines, poles and insulators
- Increasing labour productivity in the field of fault location databases
- Optimizing of preventive measures regarding the technical sate of the network
- Optimizing the company’s potential and the use of its resources
- Optimizing network infrastructure management
- Improving the planning and development of networks
Since being founded in 1999, Visimind has been working on projects for all of the major energy companies in Scandinavia, Poland, France and Italy.
Our clients have included:
- Sweden – Vattenfall, Ellevio, E-ON, Trafikverket
- Finland – Caruna, KEAB, Elenia
- France – ENEDIS, EDF-SEI, Gérédis, Rte
- Norway – TrønderEnergi, Hafslund
- Poland – PSE-Operator SA, Energa-Operator SA, Enea-Operator SA
- Italy – Terna, Enel
Our solutions are mainly used for the inspection and documentation of power lines, as well as contributing to the functioning of our clients’ spatial information systems.