DPM 3D Inspection is a complex GIS software that integrates with a multitude of capabilities for displaying, visualizing, conducting analyses, and simulations on multisensor data, encompassing lidar, maps, images, and three-dimensional data.
The DPM 3D INSPECTION comprises several key modules, each serving distinct functions within the software ecosystem:
- Map
- Lidar
- Picture inspection with backprojection
- Georadar
- Road inspection
- 2D and 3D digitalization
- Powerline profiles and crosssections
- Collision detection
- Dangerous trees detection
- Vegetation analysis

Data from multiple sensors
Combining synchronous display of data from RGB, multispectral, thermovision, and corona cameras entails integrating a diverse array of sensor outputs into a cohesive visual representation. Additionally, incorporating data from a wide range of lidar scanners enhances spatial understanding and depth perception. These inputs are further processed and presented in multiple formats to facilitate analysis and decision-making across different industries.

Multiple file formats support
Our software enables work with files in many formats commonly used within GIS. We have the capability for both reading and writing in multiple formats. This allows users to easily import data from various sources and export it to selected formats according to their needs. We provide flexibility and support for a wide range of file formats, facilitating integration with existing GIS systems and data exchange with other users and tools.
Support for JPG, RRD, IIQ, PNG, LAS, LAZ, PLS, PL3, XYZ, CSV, XLS, XLSX, DXF, DGN, GeoJSON, SHP, XML, ASC, VRT, JP2, GIF, TIFF, ECW, ECX, MID, MIF, WPT, PDF, TXT, KML, PNT and many others

Asset management process support in multiple industries
Our software offers comprehensive support for asset management and failure detection across a range of infrastructure grids, including Powerline, Gas pipeline, and Heat pipeline systems. Additionally, it extends its capabilities to cover Roads and Environment management tasks.
By providing a comprehensive suite of tools and functionalities, our software empowers organizations to efficiently manage and maintain their infrastructure assets, enhance safety and reliability, and optimize operational performance.


Here's a more detailed breakdown of the features it provides:
Asset Management
Efficiently manage assets associated with power lines, gas pipelines, heat pipelines, roads, and environmental elements within a geographic information system (GIS) environment.
Failure Detection
Utilize advanced algorithms and data analysis techniques to detect potential failures or anomalies within the infrastructure grids, enabling proactive maintenance and minimizing downtime.
Collision Detection
Identify and prevent potential collisions between infrastructure elements, ensuring the safety and integrity of the grid network.
Dangerous Trees and Object Detection
Automatically detect hazardous trees, objects, or obstacles near the infrastructure, reducing the risk of damage and improving safety.
Vegetation Analysis
Conduct detailed analysis of vegetation growth patterns and their potential impact on infrastructure, aiding in proactive maintenance and vegetation management strategies.
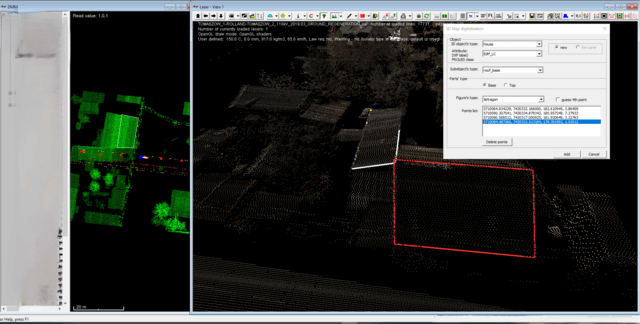
Classification of pointcloud
Our software offers the capability to classify objects both from a point cloud view and from a map view. By offering classification capabilities in both point cloud and map views, our software enables users to effectively analyze and annotate spatial data from different perspectives. This flexibility facilitates more efficient object identification and classification workflows, leading to enhanced data interpretation and decision-making in various applications such as urban planning, infrastructure management, environmental monitoring, and more.
Here's how it works:
3D Point Cloud View ClassificationUsers can interactively classify objects directly within the point cloud data. This involves identifying and labeling individual points or clusters of points corresponding to specific objects such as buildings, trees, vehicles, or other structures. Advanced algorithms may assist in automating this process by analyzing point attributes such as intensity, color, or geometric features to classify objects accurately. Users can also manually refine classifications as needed, ensuring precise identification of objects within the point cloud.
2D Map View ClassificationIn addition to point cloud visualization, our software provides a map-based interface for object classification. Users can view the point cloud data overlaid onto a map or aerial imagery and classify objects directly within this context. This allows for a more comprehensive understanding of the spatial relationship between objects and their surroundings. Classification tools may include drawing polygons or shapes around objects on the map, assigning object types or attributes, and editing classifications based on visual inspection.


Expanding on visualizing point clouds using different methods
By utilizing these visualization techniques, users can gain valuable insights from point cloud data, facilitating tasks such as feature extraction, terrain analysis, and infrastructure assessment with enhanced clarity and precision.

Classification
Visualize the point cloud by categorizing points based on their classification attributes. This includes distinguishing between ground, vegetation, buildings, and other objects, allowing for clear identification of different features within the environment.
RGB
Display the point cloud using color information derived from Red, Green, and Blue channels. This technique adds color to each point based on the colors captured by the sensor during data acquisition, providing a realistic representation of the scene.
Intensity
Represent the point cloud based on the intensity values captured by the sensor. This method assigns grayscale shades to points based on their intensity, which can indicate reflectance or brightness levels of surfaces, aiding in distinguishing between different materials or surface characteristics.
Echo, Return Number, Number of Returns
Visualize the point cloud based on echo attributes, which represent the order in which the laser pulses return to the sensor. This includes displaying points based on their return number (first, single, intermediate, or last return) or the number of returns recorded for each pulse, providing insights into the vegetation canopy structure or surface complexity.
Height/Height above ground
Display the point cloud by representing the elevation or height values of points relative to a reference datum, such as the ground level or a specified vertical datum. This allows for visualizing terrain elevation variations or the height of objects above the ground surface, aiding in tasks such as terrain modeling or infrastructure planning.
Reports
Automatic report generation based on collected data relies on synthesizing information from multiple sensors, enabling detailed environmental analysis and condensing key findings into reports or other final products.
- Data synthesis from multiple sensors: Our platform integrates data from various sensors such as LiDAR, RGB cameras, or thermal imaging to obtain a comprehensive picture of the environment and infrastructure.
- Object proximity analysis: Using this data, our system generates reports containing object proximity analysis. This provides clients with information about distances between objects and their mutual relationships.
- Vegetation analysis: Our platform also performs vegetation analysis, identifying forested areas and potential threats associated with excessive vegetation growth. Reports include information on vegetation status and recommendations for remedial actions.
- Thematic maps: We generate thematic maps presenting various aspects of the environment, such as terrain topography, object distribution, or vegetation location. This allows clients to better understand the spatial context of their operations.
- CAD drawings:Our platform also generates CAD drawings that can be used for infrastructure design or maintenance planning. This provides clients with detailed information about the layout and dimensions of objects in space.
- Customization of the final output: Our reports and other final products are tailored to individual client requirements to best meet their business needs. We provide flexibility in data presentation, report format, and analysis scope.
By enabling automatic report generation and synthesizing information from multiple sensors, our platform enables clients to obtain comprehensive, accurate, and useful data for decision-making and managing their operations.


Features
Thermovision mesurments
Thermal measurements in our software encompass a comprehensive range of functionalities, including measurements of values for various surfaces along with statistical analysis, hot spot analysis, detection of infrastructure network faults, as well as utilizing temperature data for simulating the behavior of power lines under different weather conditions and loads.
- Surface Measurements and Statistics: Our software facilitates precise thermal measurements across diverse surfaces. It allows users to measure temperature values at multiple points on surfaces, providing detailed insights into temperature distributions. Additionally, statistical analysis tools enable users to analyze temperature data comprehensively, including calculating averages, standard deviations, and other statistical parameters.
- Hot Spot Analysis: Our software includes advanced tools for hot spot analysis. You can detect areas with anomalously high temperatures very quick.
- Fault Detection in Infrastructure Networks: Leveraging thermal imaging capabilities, our software enables the detection of faults in infrastructure networks such as electrical systems or pipelines. By analyzing temperature variations, users can pinpoint areas of concern, such as overheating components or leaks, facilitating timely maintenance and preventing potential failures.
- Simulation of Power Line Behavior: Our software goes beyond basic thermal measurements by simulating the behavior of power lines under different environmental conditions and loads. By incorporating temperature data into simulation models, users can assess the thermal performance of power lines, predict potential overheating or sagging, and optimize operational parameters to ensure reliability and safety.
By offering these advanced capabilities, our software empowers users to conduct comprehensive thermal analysis, enhance infrastructure maintenance practices, and optimize the performance of power distribution systems in diverse operating environments.

Creating DTM/DSM/NDSM models
Our software provides users with the flexibility to create different types of terrain and surface models tailored to specific areas and standards. Whether it's generating models for detailed terrain analysis, environmental planning, or infrastructure design, our software offers versatile tools to meet various needs.
With the ability to export models in standard formats such as TIFF, ASC, and XYZ, users can seamlessly integrate their data into existing workflows and collaborate with colleagues using different software platforms. This compatibility ensures efficient data exchange and interoperability across projects and teams.
Whether users require raster graphics data in TIFF format for GIS applications, grid-based elevation data in ASC format for terrain modeling, or point cloud data in XYZ format for 3D modeling and visualization, our software delivers. It allows users to customize the output according to industry standards and project requirements, ensuring compliance and consistency in data representation.
By offering a comprehensive solution for terrain and surface modeling, our software empowers users to analyze, visualize, and communicate geographical data effectively, driving informed decision-making and enhancing project outcomes.

Advanced images enhancement
Our software offers a variety of options for processing images, including creating thumbnails and changing resolution. The available tools allow users to optimize their photos for brightness or histogram correction, tailoring them to their specific needs and preferences.

Powerline digitalization
Advanced digitization of power line elements in our database includes detailed mapping of critical line components. Subsequent vector-based analyses allow for calculating distances to hazardous objects and simulating the line's condition under various weather conditions.
By utilizing advanced digitization of power lines, our software ensures that all critical information is comprehensively recorded, systematically stored, and easily accessible. This enhances the capability for effective management and maintenance of transmission line infrastructure, supports detailed analysis, and facilitates the generation of personalized reports, ultimately contributing to the improvement of the reliability, safety, and efficiency of the transmission line network.


Conductors simulations
Our software offers comprehensive powerline simulation capabilities, allowing users to model and analyze the behavior of powerlines under various conditions. These simulations are designed to provide detailed insights into how different factors, such as weather conditions, conductor temperature, and conductor-specific sag, impact the performance and safety of powerline infrastructure.


Our software can simulate the effects of various weather conditions, including:
- Temperature Variations: Assessing the impact of ambient temperature changes on conductor performance and line sag.
- Wind Loads: Analyzing how different wind speeds and directions affect the mechanical stress and displacement of powerlines.
- Ice and Snow Accumulation: Evaluating the additional load and resultant sag due to ice and snow buildup on conductors.
By simulating conductor temperature under various operating conditions, the software provides insights into:
- Thermal Expansion: Understanding how temperature changes lead to thermal expansion or contraction of conductors, affecting line sag and tension.
- Current Load Impact: Modeling how different electrical loads influence conductor temperature and resultant sag.
All simulations are visually represented in point clouds as well as in cross-sections and profiles of power lines. The various forms of visualization allow for detailed analysis and understanding of this phenomenon.
Our software specifically supports HTLS conductors, allowing users to:
- Simulate Performance: Model the behavior of HTLS conductors under high-temperature conditions and heavy electrical loads.
- Optimize Usage: Analyze the benefits of using HTLS conductors in terms of reduced sag and increased capacity.
The results of these simulations provide critical data for:
- Design and Planning: Enhancing the design and planning of powerline installations by predicting behavior under different scenarios.
- Maintenance and Operations: Supporting maintenance decisions by identifying potential issues due to weather impacts, temperature variations, and mechanical stress.
- Safety Assurance: Ensuring safety standards are met by analyzing clearance distances and sag under various conditions.
Our software’s powerline simulation capabilities provide a powerful tool for engineers and operators to understand and optimize the performance of powerline infrastructure. By modeling various weather conditions, conductor temperatures, and specific sag characteristics, and supporting advanced conductors like HTLS, our simulations offer valuable insights that enhance the safety, reliability, and efficiency of powerline systems. The detailed visual representations in cross-sections and profiles further aid in clear communication and effective decision-making.
Digitalization of 2D and 3D objects
Our software excels in the digitalization of both 2D and 3D objects, including Building Information Modelling (BIM) and detailed representations of roof areas. These digital models are accessible in both 2D maps and laser views, providing a comprehensive visualization of structures and their components.

Recommended spec:
- OS: Windows 7/8/10/11 (64bit)
- Hardware: RAM 8GB, Intel Core i5/Intel Core i7, 1GB free space, Graphic Card 4 GB V-RAM